
Last week’s numbers, charted and explained.
A report your team reads in 30 seconds.
How it works.
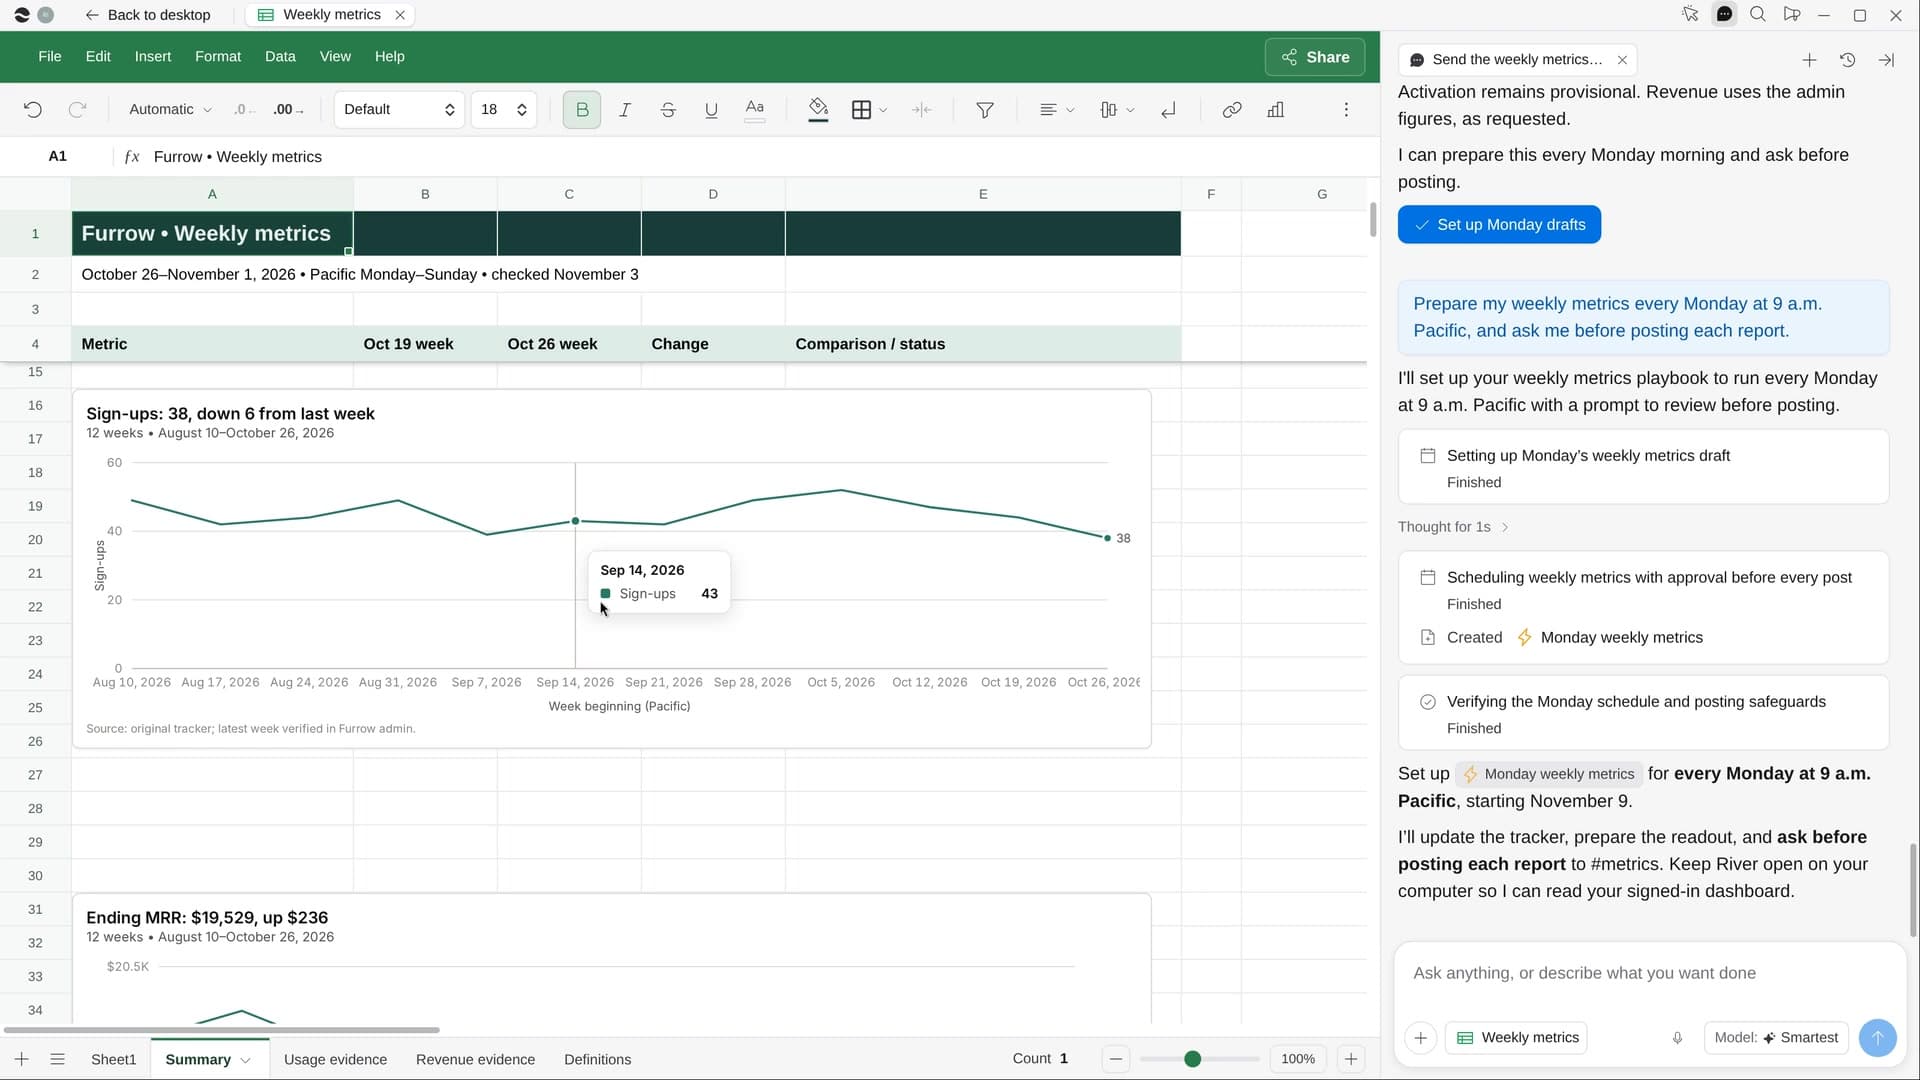
River pulls last week from Stripe, your CRM and the dashboards you already report from, adds it to your metrics Sheet with charts and traces every big move to the rows behind it.
Confirm the numbers that matter
Six to eight, picked from your last report or board deck, and where the report usually goes.
River pulls every source
Revenue, pipeline, usage and support, added as a new week with the change from the last one.
What moved, and why
Three lines naming what drove each big move, posted to your channel once you say yes.
What you get.
- This week added to your metrics Sheet, with live formulas and trend charts
- A dated weekly Page and a post your team can read in 30 seconds
- Every number traceable to its source, and a named cause for every big move
Start in three steps.

Get River
Download the app for your computer.
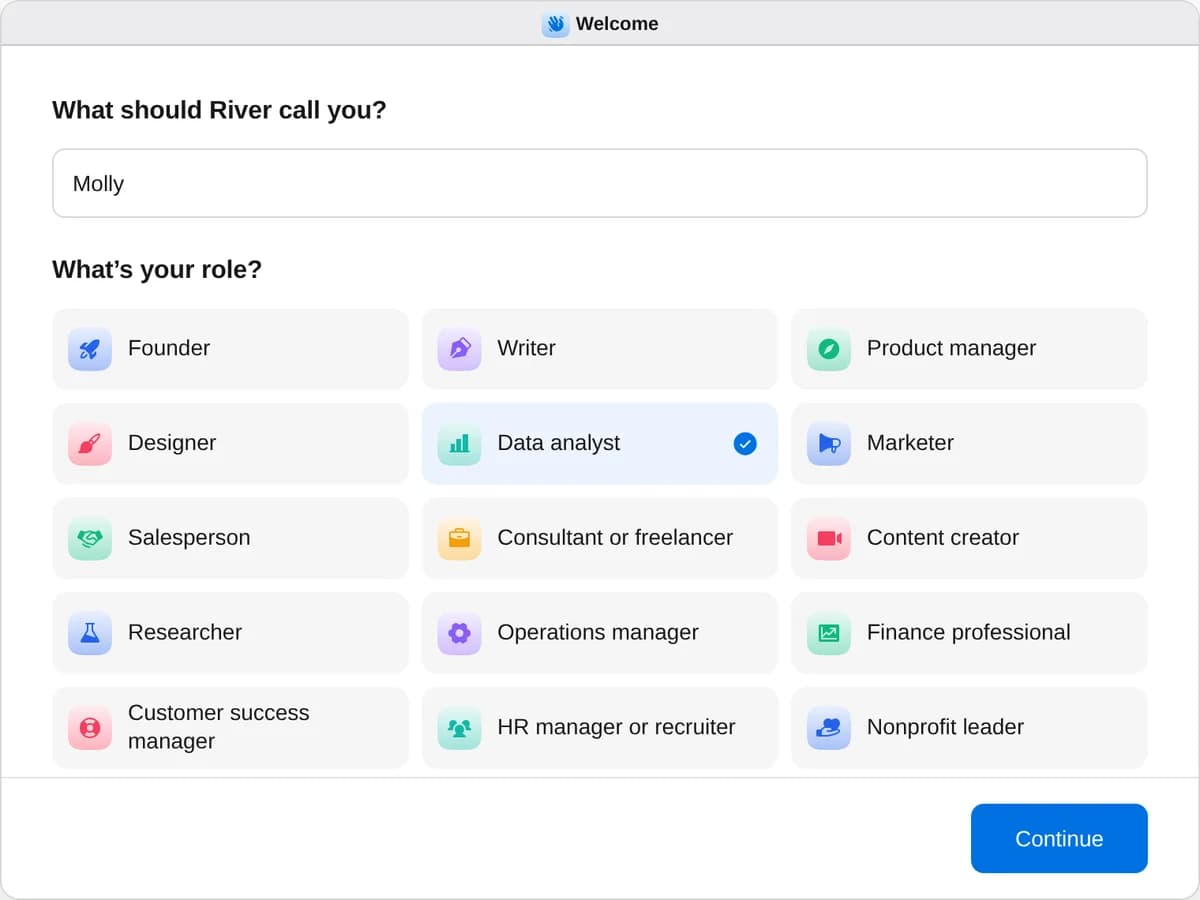
Sign up as a data analyst
When River asks your role, choose Data analyst.
- Playbooks
Data analyst
Start a playbook and River works through it with you in the chat.
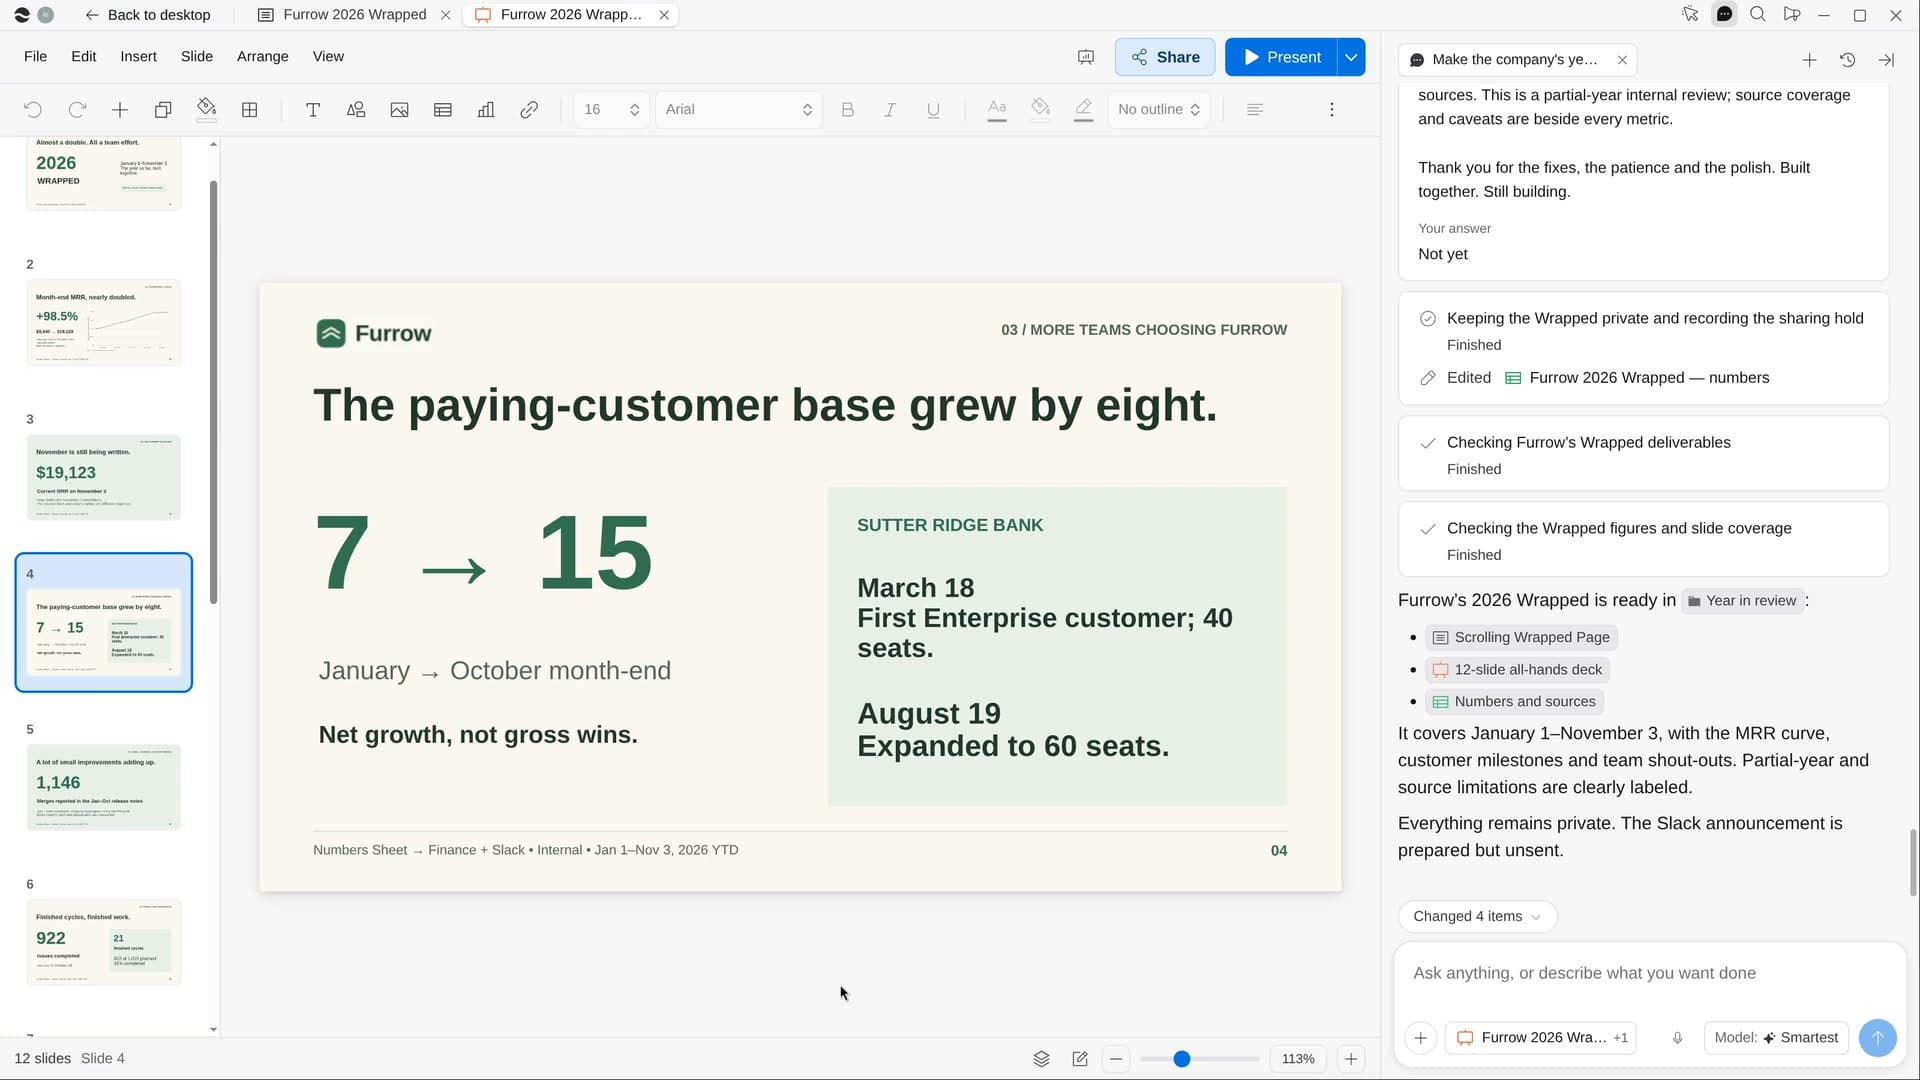
StartSend the weekly metrics reportEvery week River pulls your key numbers, charts them and writes what changed and why, ready to post.StartFind out why a number movedName a number that dropped or jumped: River checks every likely cause and shows you the evidence.StartMake the company’s year in reviewRiver turns your year in Slack, GitHub, Stripe and more into a fun Wrapped for the all-hands.Start “Send the weekly metrics report”
Press + in your Dock, open Playbooks, and press Start. River proposes six to eight numbers from your last report and asks where it goes.
A few things to know.
Do I need a new spreadsheet?
River adds the week to the tracker your team already keeps: a row per week, the change as formulas, each definition written once. The first run backfills 8 to 12 weeks of history.
Which sources does it use?
The ones your team already reports from, as named in the last post, the Sheet’s notes or the board deck: Stripe, the CRM, the admin dashboard. It doesn’t go hunting for tools you don’t use.
What does it cost?
It uses your plan’s AI credit, like everything else in River. It posts to the Slack channel or email list you already use.
View pricing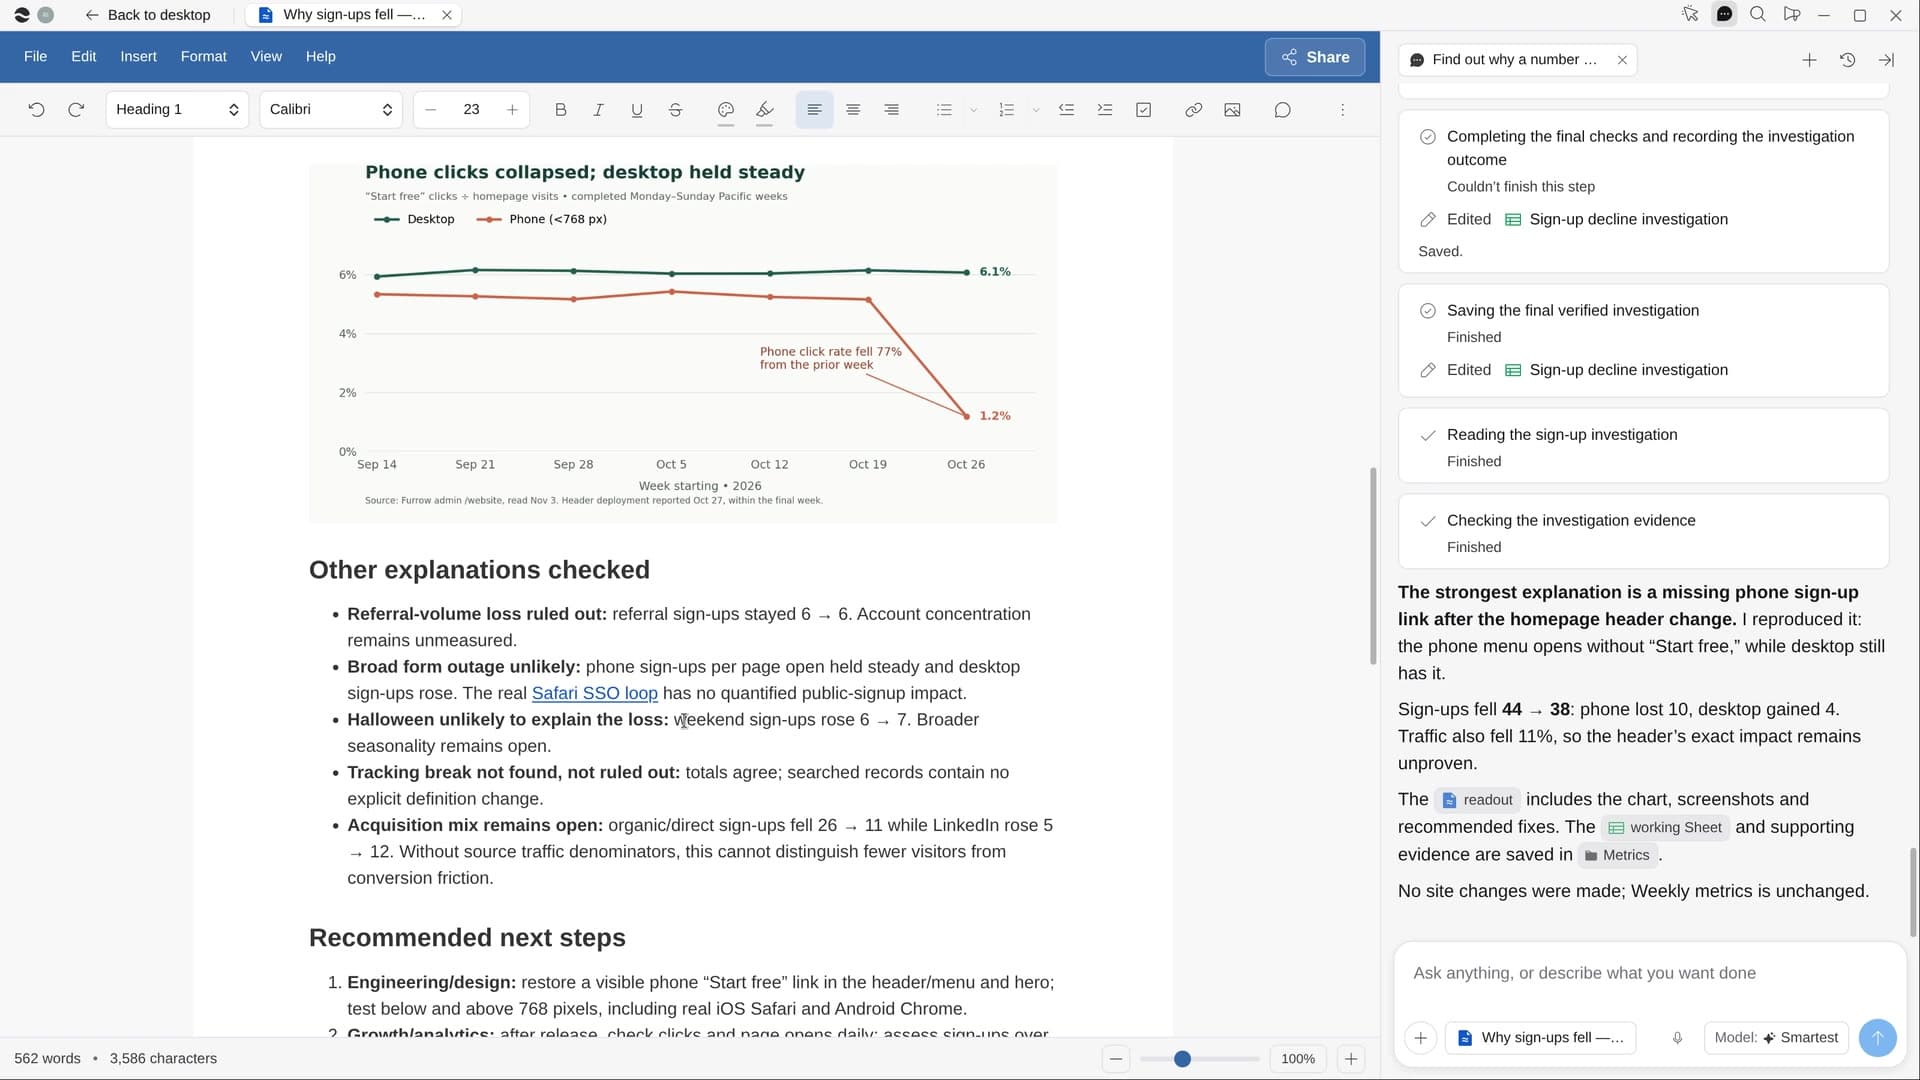
Try it on your own work.
Download River, choose Data analyst, and press Start on “Send the weekly metrics report”.